From the academic to the business research, Statistical Analysis is widely used in authenticating a piece of information. Statistical Analysis is the process of collecting and interpreting data to find patterns and trends. This is part of the process of Data Analysis. It is used as a research tool by Scientists, Governments, Businesses, and other Organizations. Statistical Analysis is helpful for research interpretations, statistical modeling, survey and study design, among other things.
Achieving meaningful results in Statistical Analysis requires careful planning from the beginning of the Research process. It aids users in Data Management, Predictive Analysis, Business Intelligence, and Multivariate Analysis. In the settings of Business Intelligence (BI), Statistical Analysis involves collecting and testing each data sample into a set of objects from which the samples can be taken. In Statistics, a sample is a random sample obtained from a large population. The purpose of Statistical Analysis is to find tendencies.
List of Efficient Statistical Software
Mostly we consider the Statistical Analysis a most difficult part of the research procedure, but it does not have to be. The thing you need to know is only what to do with the data and explicate the results. And Statistical Analysis Software make this procedure simple and comprehensive as possible. Statistical Analysis Software are tools for analyzing raw data that you can use in your daily work.
In addition to this, these software can be used for data interpretation and intuitive display. Statistical Analysis Software is a type of computer program that can help you collect, organize, analyze, interpret, and statistically design data for your study. There are many tools available for Statistical Data Analysis, and we have compiled a list of the best software for your ease.
1. SAS/STAT
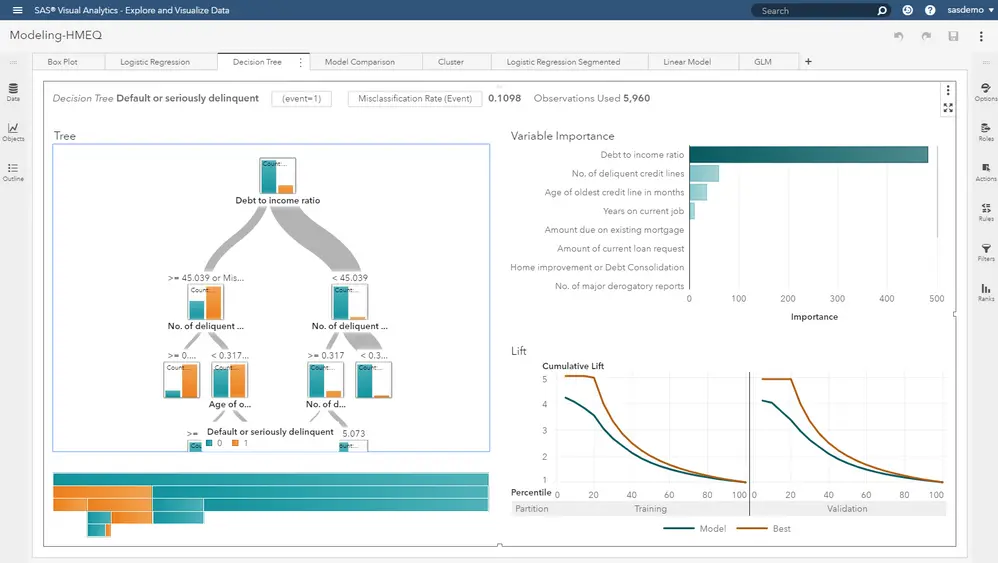
SAS/STAT is a comprehensive and scalable business intelligence software designed to help you make better decisions. SAS/STAT makes it easy to understand what you are looking at in just a few seconds with charts, graphs, and interactive visuals rather than depending on your intuitions to make decisions. Its visualization is customizable, making it easier than ever to see the information that matters most.
It also allows you to dig deeper into those visuals and explore to find new trends, details, insights, and more you wouldn’t otherwise know about. There is an entire library of pre-built Statistical Analyses and procedures to make things easier that you can use to inform your own procedures without having to start from scratch. You can instantly visualize data, determine outliers, spot trends, predict future outcomes, and identify correlations and opportunities. And more, it connects with just about every data source you can imagine for automatic syncing as the latest data comes in.
2. Microsoft Excel
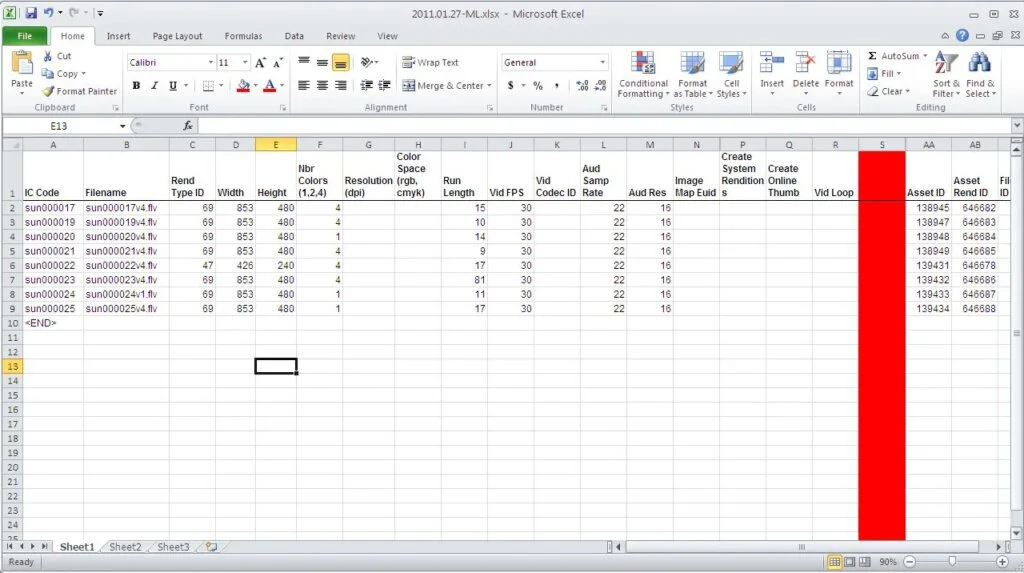
MS Excel is a software that possesses a wide diversity of features that are use for data presentation and statistics. Even though it is not a cutting-edge solution for Statistical Analysis, it can be used for making summary metrics and customizable graphics and figures. All these features make it a functional tool for many people who want to comprehend the basics of their data. Many individuals and enterprises are generally known to use Excel, it is easy to learn that makes it an accessible option for those looking to get started with statistics.
This software makes it easy to review and analyze data, use a budget tracker, and more. This Excel spreadsheet provides you with the features of creating, editing, viewing, and sharing files and workbooks attached to the emails. Users can edit documents for Data Analysis, Accounting, Finance, and other fields with confidence. They can create charts, run analyses, edit data and annotate documents from their phone anytime. Accounting on the go is made easy with access to spreadsheets and a chart maker.
3. Power BI
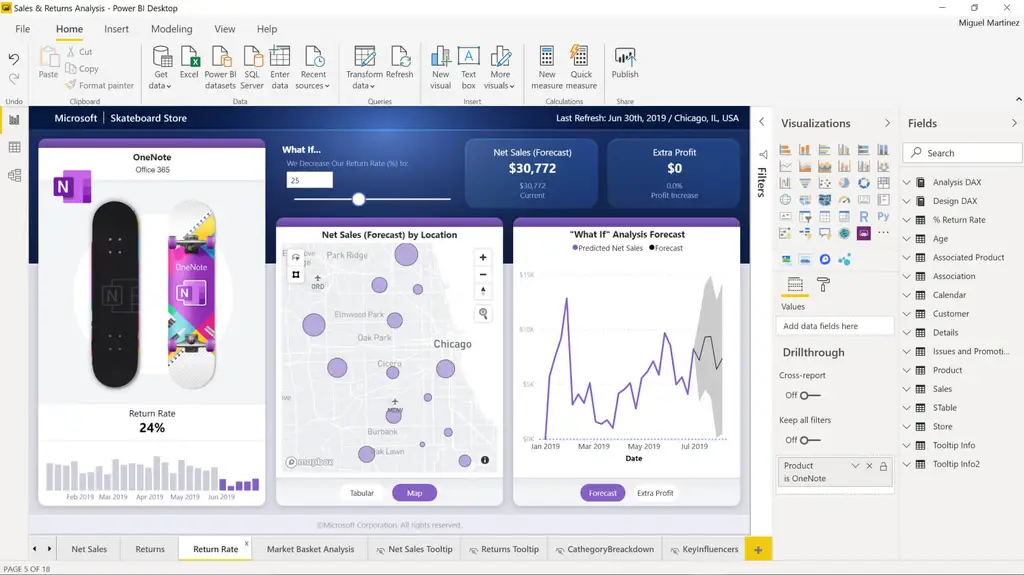
The Microsoft Power BI delivers the BI experience for Power BI, Power BI Report Server, and Reporting Services. Users can easily view and interconnect with their enterprises control panel on its basis and in the cloud from anywhere, with live, touch-enabled mobile access. Power BI sets visual analytics at your fingertips. With this powerful, reliable software, you can create interactive data visualizations and reports. Connect, mash up and model, and visualize your data.
This software places visuals exactly where you want them to be analyzed, explores your data and shares content with your team by publishing to the Power BI Web Service. You can use the Power BI web service to monitor key data and share dashboards and reports. Power BI Desktop is part of the Power BI product suite. Use Power BI Desktop to create and distribute BI content.
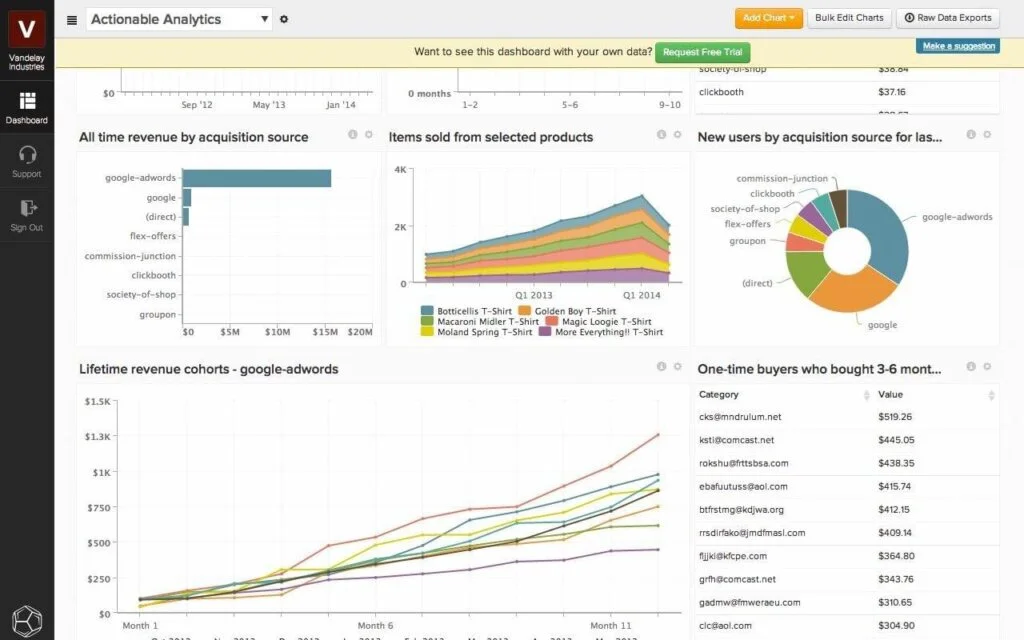
4. Tableau
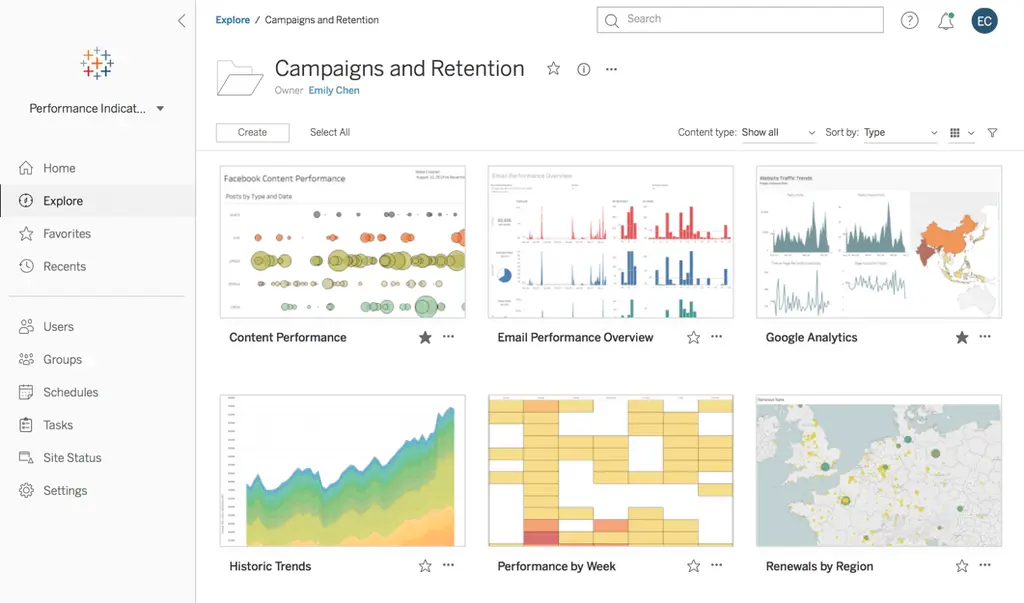
Tableau aids you in converting data into actionable insights that make an impact. It easily connects to data stored anywhere, in any format. You can also connect to virtually any data source with this tool. It can work with any shape, size, and type of data, whether on-premises, cloud applications, or flat files. Its hybrid connectivity aids both live analysis and bringing data in memory via encrypted extracts. Tableau neatens and straightens out the business intelligence industry with interactive, visual analytics that helps you eliminate the backward and forward changes in the requests of traditional reporting.
It allows you to analyze data quickly and easily in a valuable format for anyone and everyone. It quickly performs impromptu analyses that reveal hidden opportunities. You just drag and drop to create an interactive control panel with advanced visual analytics. Then share your work with anyone and make an impression on your business. This app is widely used by many people everywhere to view and explain the data, from international enterprises to small businesses (early-stage startups).
5. SPSS Statistical Software

SPSS Statistics Software aids you find new relationships in the data and predicting what will likely happen next. Most of its users employ SPSS Statistics Software to solve industry-specific and business issues and to empower the quality of decision-making. Its visualization and innovative statistical procedures enable you to recognize your data and solve complex business and research problems and make it a robust, user-friendly, integrated platform . It works on all aspects of the analytical process, from preparation of data and management to analysis and reporting of data. It provides personalized functionality and customizable interfaces for different skill levels and functional responsibilities.
This program helps in making graphs and presentation-ready reports to easily communicate the results. Mostly, all types of enterprises and organizations have used this SPSS Statistics technology to increase revenue, outmaneuver competitors, conduct research, and data-driven decision-making. The significance of this software lies in the fact that the tech giant IBM acquired it for its robust features, high-end capacities to perform statistical functions, and sophisticated graphical user interface. Since its acquisition by IBM, it has improved a lot, and today it is used by many universities, businesses, researchers, and organizations.
6. Apache Spark
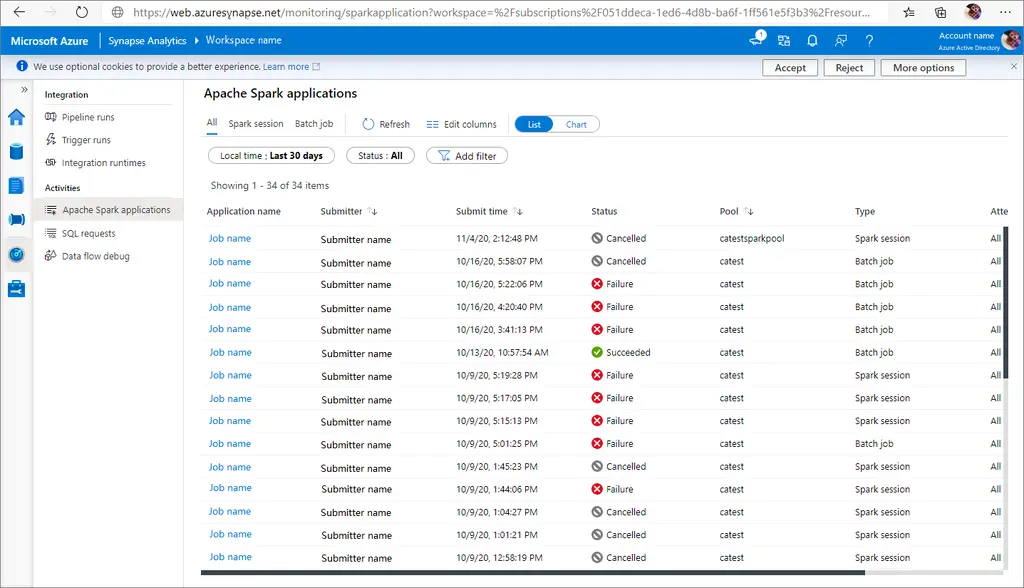
Apache Spark (Spark) is an open-source data-processing engine for large data sets. It provides an interface for programming clusters with implicit data parallelism and fault tolerance. It works for the scalability, computational speed, and programming that is necessary for huge data, including Machine Learning, Data Streaming , Data Graphing, and Artificial Intelligence (AI) applications. This software is highly effective for batch and streaming data. Its effectiveness is because of its feature ‘state-of-the-art’ directed acyclic graph scheduler, a query optimizer, and a physical execution engine.
Spark controls a stack of libraries, including SQL and DataFrames, MLlib for machine learning, GraphX, and Spark Streaming. You can combine these libraries impeccably in the same application. This program offers more than 80 high-level operators that make it easy to build similar apps. It even includes APIs for programming languages that are popular among data analysts and data scientists, including Scala, Java, Python, and R. You can run workloads 100 times faster than Hadoop MapReduce.
7. Stata
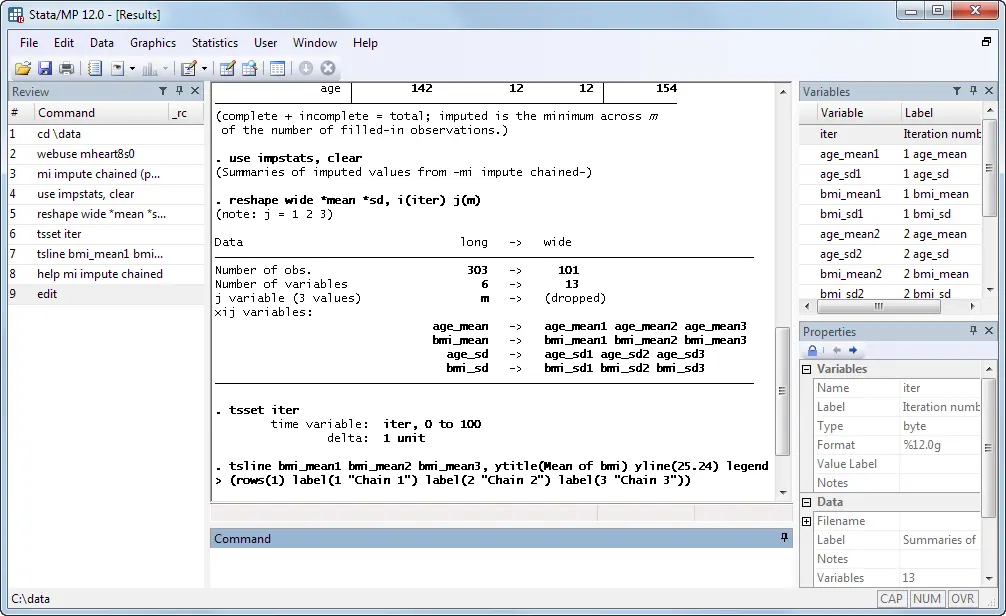
Stata is a Statistical tool made for data analysis, data manipulation, exploration, visualization, and statistical analysis. It can offer all the tools the users need to perform data analysis. It includes a broad suite of statistical functions,with panel/longitudinal data, time series analysis, survival analysis, but not limited to linear models. the other feature provided by this are Bayesian analysis, selection models, choice models, extended regression models, generalized linear models, finite mixture models, spatial auto-regressive models, nonlinear regression and more.
Stata is available to users with or without coding knowledge with both a graphical user interface and command-line structure. It offers some graphics customization levels, as users can modify the size of the text, markers, margins, and other elements in their graphics. Stata is accessible in four different packages, which can analyze different numbers of variables and require more or less memory to route; Stata/MP (the fastest and largest version of Stata), Stata/SE (Stata for large datasets), Stata/IC (Stata for mid-sized data sets), and Numeric by Stata (Stata for embedded and web applications).
8. OriginPro
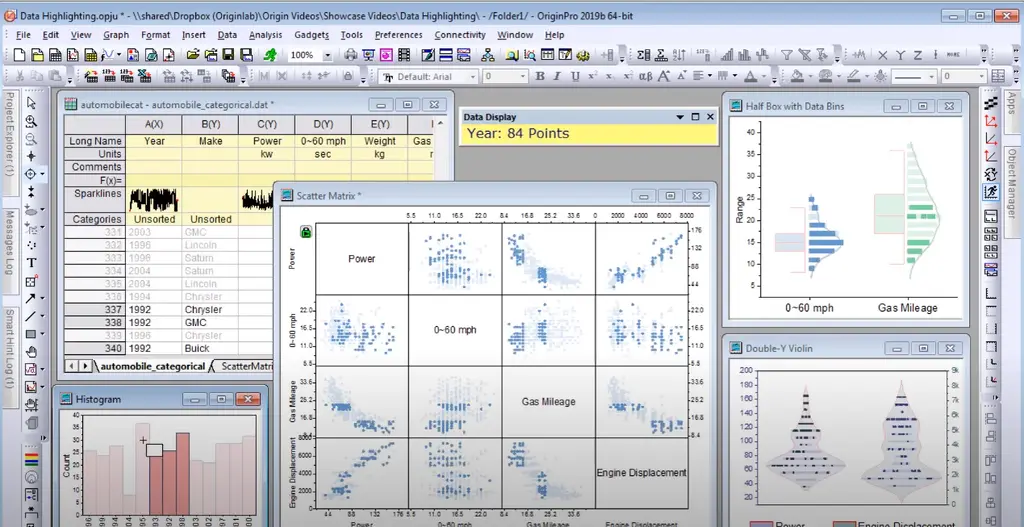
OriginPro is a cloud-based data analysis and graphing tool used in academic institutions, government organizations, non-profits, or businesses with data exploration. It provides gears for peak fitting, surface fitting, statistics, and signal processing. Its features have batch processing, peak analysis, project management, surface integration, and cluster gadgets. The application enables engineers to perform various non-parametric tests such as sign tests, Mood’s Median test, Kruskal-Wallis ANOVA, Mann-Whitney test, and more.
Users can make custom graphs of multiple types, including piper diagram, means plot, heat map, correlation plot, and image stack profile, and save them as templates for future use. Using OriginPro, professionals can do mathematical operations, interpolation/extrapolation, area calculation, and differentiation and integration. Engineers can also perform multivariate analysis using K-means, hierarchical, discriminant, and partial least square tools. OriginPro offers various sectors individual or group licensing options and extends support via email, call, chat, and documentation.
9. XLSTAT

The leading Data Analysis and Statistical Software for Microsoft Excel. XLSTAT is a powerful and flexible Excel data analysis add-on that allows users to analyze, customize and share results within Microsoft Excel. XLSTAT is the preferred instrument for statistical analysis in businesses and universities, large and small, and for 110,000+ users in over 120 countries worldwide, with over 240 standards to advanced statistical features available.
XLSTAT allows you to use some XLSTAT functions within your Excel sheet directly. The currently available features solve numerical issues that have been found with the built-in Excel functions or complement the set of Excel statistical functions. They are accessible from the Insert function menu of MS Excel.
10. Zoho Analytics
Zoho Analytics is a self-service Business Intelligence and data analytics program that lets you analyze your data, create stunning data visualizations, and find hidden insights in minutes. Zoho Analytics offers various reporting options such as Charts, Pivot tables, Summary views, and Tabular views. The intuitive drag and drop interface of Zoho Analytics allows you to make reports with ease. It enables you to import data from various data sources such as local files, Web URLs, Google Drive, Local/Cloud databases, popular business applications, and your custom applications for in-depth reporting and analysis.
It lets you analyze data from various data sources through easy-to-use data connectors. It provides powerful options to model and prepares your data. This allows you to structure, transform & clean your data set for effective and easy analysis & reporting. Zoho Analytics permits you to predict future values or identify the past & future trends in your data with a simple process, without worrying about the underlying complexity. You can also derive complicated calculations in just a few steps to create powerful reports.
11. Scilab
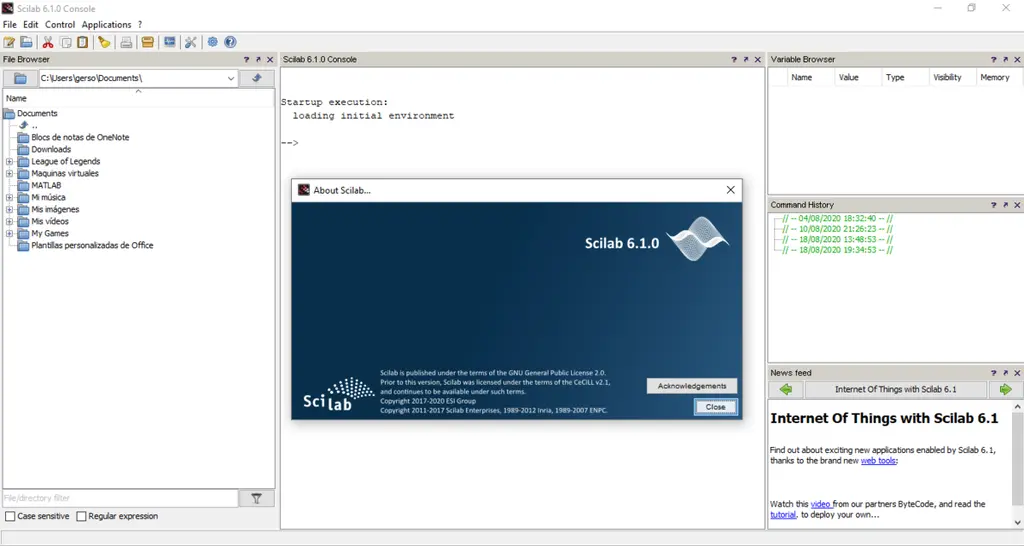
Scilab is a free, open-source, cross-platform numerical computational suite and a high-level, numerically oriented programming language. It works for signal processing, statistical analysis, image enhancement, fluid dynamics simulations, numerical optimization, modeling, explicit and implicit dynamical systems simulation, and (if the corresponding toolbox is installed) symbolic manipulations. While the language provides simple matrix operations such as multiplication, the Scilab package also provides a library of high-level operations such as correlation and complex multidimensional arithmetic. This allows users to construct models for a range of mathematical problems rapidly.
12. Minitab 19
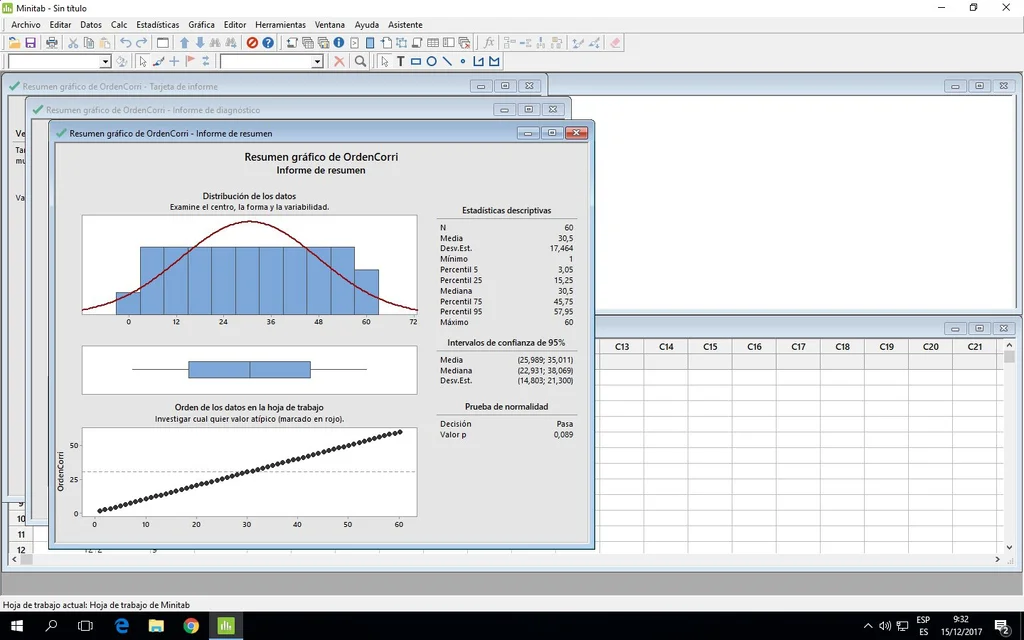
Minitab 19 is an intelligent data analysis software and provider of expert statistical services. This Statistical Software is a better, quicker, and easier solution for executives, professionals, educators, and students. Its latest version delivers on its pledge to serve practitioners analyze larger data sets in better, faster, and more accessible manners, no matter where they are on their analytics journey. Minitab 19 Software provides statistical analysis, visualizations, predictive and improvement analytics to enable data-driven decision making.
Minitab Statistical Software is the global product of choice across many disciplines, including academia, operational excellence, quality improvement, Lean Six Sigma, manufacturing, research and development, marketing, and many more. Notwithstanding statistical background, Minitab enables organizations through easy-to-use software, using an intuitive user interface, clicks not code, the Minitab assistant, and its global support network of expert statisticians.
13. Domo
Domo is a cloud-based business management platform that integrates multiple data sources, including spreadsheets, databases, social media, and any existing cloud-based or on-premise software solution. It is compatible with company sizes ranging from small businesses to large enterprises, can run on Windows or Mac platforms, iPad tablets, and also works on mobile devices. Domo offers both micro and macro level visibility and analysis, from cash balances and top-selling product lines to forecast revenue by region, marketing return on investment (ROI) by channel, and more.
It offers real-time dashboards with data about multiple business areas and performance metrics (e.g., key performance indicators, ROI, etc.). This tool also provides interactive visualization tools and instant access to company-wide data via a centralized dashboard. Users can filter, combine, and personalize the data they want into one or multiple dashboards.
14. JASP
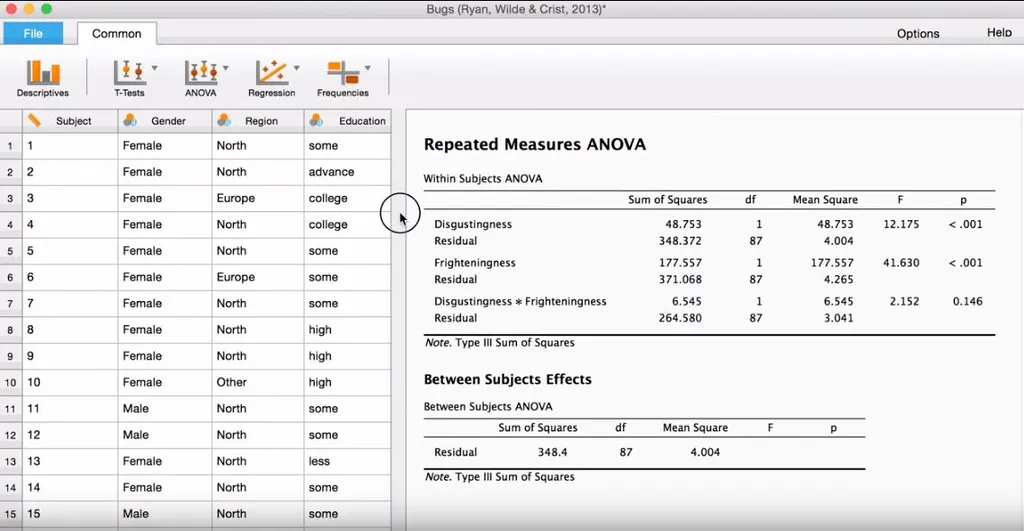
JASP is a free and open-source software for Statistical Analysis supported by the University of Amsterdam. It is devised to be easy to use and familiar to users of SPSS. It offers standard analysis procedures in both their classical and Bayesian form. JASP generally produces APA-style results tables and plots to ease publication. It promotes open science by integration with the Open Science Framework and reproductibility by integrating the analysis settings into the results. Several universities and research funds financially support the development of JASP.
It is used for descriptive statistics and imports SPSS files and comma-separated files. Assumption checks for all analyses, including Levene’s test, the Shapiro–Wilk test, and Q–Q plot. For data filtering, use either R code or a drag-and-drop GUI to select cases of interest. Use either R code or a drag-and-drop GUI to create new variables from existing ones. It can copy tables in LaTeX format, plot editing (Raincloud plots), and export results PDF.
15. NCSS
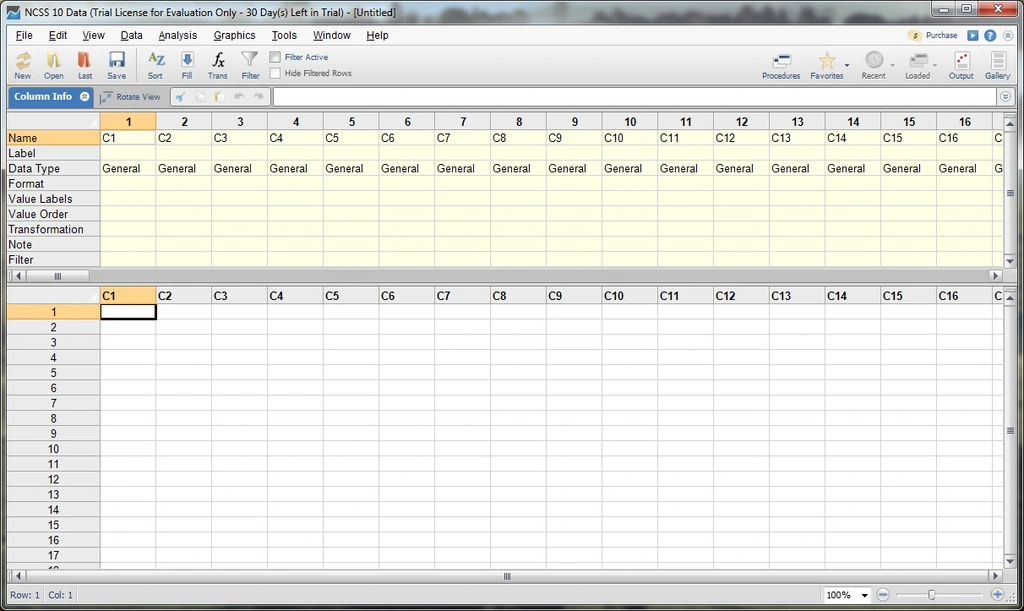
NCSS is a statistics package specializing in providing Statistical Analysis Software to researchers, businesses, and academic institutions. This software includes a comprehensive array of statistical tools, allowing the user to perform simple descriptive statistics and fairly complex statistical regression modeling. It also produces PASS Sample Size Software used in scientific study planning and evaluation. The NCSS package includes over 250 documented statistical and plot procedures.
This tool imports and exports all major spreadsheet, database, and statistical file formats. It optimizes your products using DOE, generates forecasts for time-series, or uses the cluster algorithms of NCSS to perform data mining. With all those features, the user-friendly interface helps you see the larger picture and the proper procedure at any time. Even modeling of survival times via Kaplan-Meier is no problem at all.
Final Words
Different Statistical Software tools are available, and each offers something different to the user. What you choose will depend on several factors, including your research questions, statistical knowledge, and coding experience. These are the considerations for Data Analysis which you can perform after Data Collection. However, as with any research, the quality of the data obtained depends on the quality of the study process. So it is important to keep in mind that although you may have the latest Statistical Software (and knowledge of how to use it), the results will not make sense if they are not collected correctly.