Datawrapper is the data visualization software that is used to wrap complex data in precise and easy form so that the viewer can easily understand it. The software is mainly used by journalists, software developers, and other design professionals, and it is compatible with smartphones and PCs.
The software collects the data from every platform for processing the data into charts like Excel, Google Sheets, or the web by providing the URL link. Users can do live updating through the CSV/XLS as it allows the users to use customizable charts with attractive colors for effective presentation.
Datawrapper can easily convert the data of every format, including CSVs, PDFs, and other web source links, into interesting and effective colorful charts, tables, and maps for explaining the details of complex data. The software is available for a subscription cost of 499 euros per month.
Why Do Users Want Datawrapper Alternatives?
The bottom-line issues with Data wrapper are that it contains limited features as it does not contain any native data connection list, and users can not share the dashboard feature with viewers. The only tricky parts are color-coded on the map and contain limited color scheme selection.
The software is not free to use, and even the cost of starting packages is much more expensive. It offers only online support with a good internet connection speed for sharing the data with viewers. These are some issues that Datawrapper users are fighting for and moving towards alternatives.
Lit of Datawrapper Alternatives
Datawrapper is a good software for processing complex data into simpler charts, tables, and maps for easy understanding. It collects the data from every platform for précising the data into charts like Excel, Google Sheets, or the web by providing the URL link.
Many alternatives to Datawrapper are available in the online market. Some of these alternatives are discussed in this article along with their features, pros, and cons to facilitate the users in selecting the most optimum one based on their personal needs and demands.
1. Google Data Studio
Google Data Studio is the advanced form data compiling software for businesses meetings with interactive dashboards features and offers beautiful reports for easy understanding for smart business decisions. The software can easily access a wide variety of data with built-in connectors.

The software allows the users to share their compiled data with the team members or with the world by adding the compiled data to any web page. The software is not limited to the size of businesses as it works with the same perfection even with the small, medium, or global enterprise for data précising.
Google Data Studio can easily integrate with Google Ads, Analytics, Big Query, Ad Manager, Google Sheets, Attribution 360, Campaign Manager, and many more. The software offers a simple user interface with affordable pricing plans for valuable customers and companies.
Features
- BI Standard Reporting
- Ad-hoc Reporting
- Report Output and Scheduling
- Data Discovery
- Data Visualization
Pros
- Simple Data Integration
- Design Calculated Fields
- Plots Charts and Tables
- Organize Data in Dashboard
- Easy Sharing
Cons
- Lack of Tableau Interactivity
- Difficult for Organizational Reports
- No Excel Support
- Delayed Updates
- No On-Premise Deployment
2. Geckoboard
Geckoboard is a cloud-based platform used to precise, complex data in a simpler form by describing the data with the help of dashboard tools. The software allows the users to configure their data according to the need of the team or company, and it offers a mobile app for easy use.
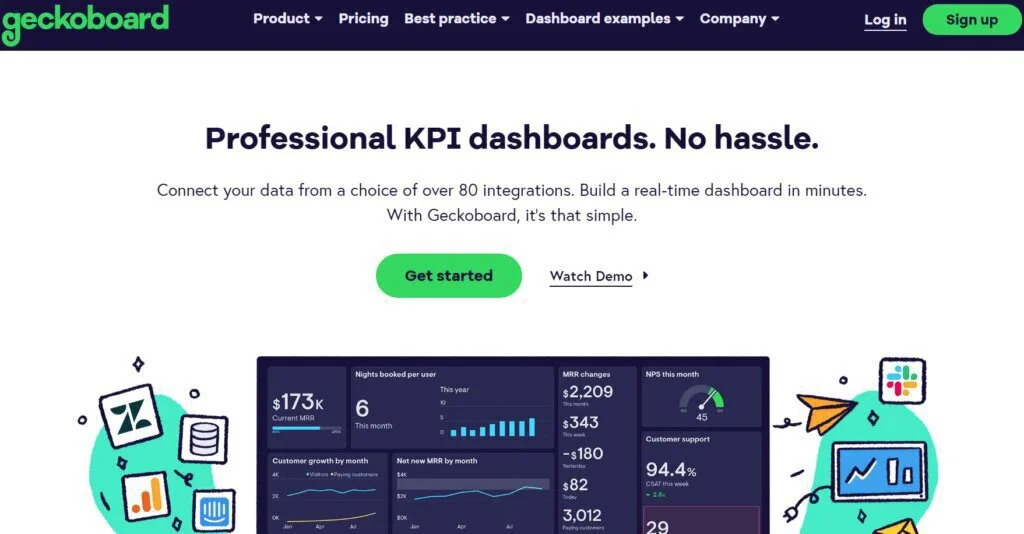
The software is embedded with valuable features for expressing the data in an interesting way. It allows the users to switch on to the big screen of the office TV so that every member of the team can easily understand the meaning of the progress with maximum clarity.
Geckoboard offers a simple user interface for setting the complex data into simple metrics with the dashboard tools. It allows users to set the visualization of the data according to their understanding. It is mostly used by Salesforce for expressing the annual sale of the team.
Features
- Customizable Dashboard
- Data Connectors
- Data Visualization
- Performance Metrics
- Real-Time Reporting
Pros
- Make Data Accessible
- Improve Teamwork
- Control Users Access
- Track Progress
- Insights On-the-Go
Cons
- Lack of Responsiveness
- Limited with Layout Size
- Limited Color Schemes
- Poor Dashboard Connection
3. Datapine
Datapine is the interactive BI platform that helps users to express data in precise form. It allows users to describe the whole data on a single centralized platform so that every viewer can easily understand the meaning of meeting by using its powerful business intelligence tools.
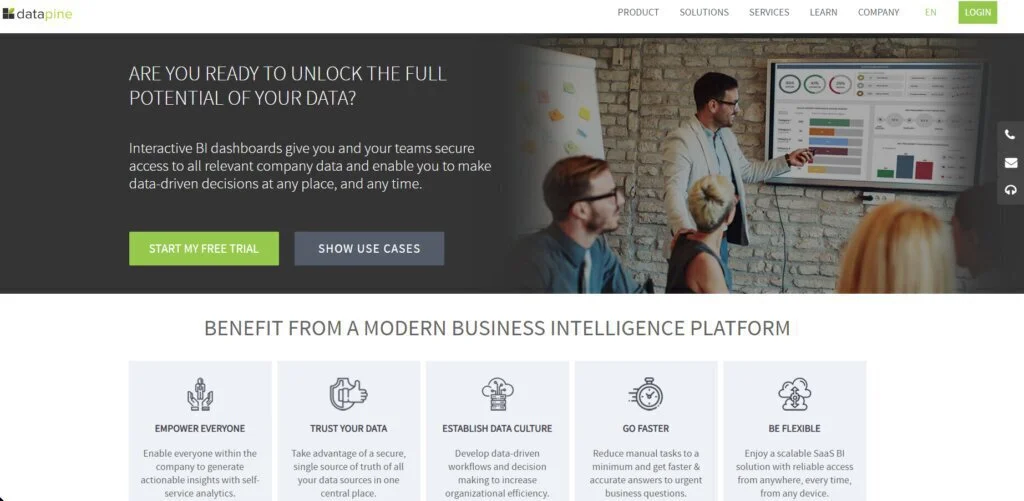
It allows the users to explore, visualize, analyze and share the data with the team to access the progress of the project. It covers six main areas, including connect, analyze, dashboards, reports, alarms, and insights for making the effective report of the data using various colors schemes.
Datapine is integrated with almost all common data sources, including database, flat files, marketing analytics, social media data, CRM, and ERP, with helpdesk data access regarding technical connection issues. The software is available for use by spending a starting price of 249 US dollars per month.
Features
- Collaboration Tools
- Customizable Branding
- Data Connector
- Data Visualization
- Financial Reporting
Pros
- Customizable Platform
- Shareable Progress
- Filtering Tools
- Zoom Capabilities
- Analyze the Performance
Cons
- Difficult SQL Mode
- Bit Expensive Plans
- No Built-in Templates
- Poor Customer Support
- Not Offers AI Learning
4. Dasheroo
Dasheroo is the online-based data managing software that helps users to manage the data related to marketing under one platform for expressing the progress of their team members. It allows the users to track the work of KPI in one place from any location at any time.
It allows users to monitor the progress of metrics from various apps like Facebook, Google Analytics, Twitter, Instagram, Mail Chimp, Salesforce, LinkedIn, and many others, all on a single podium. It saves the time of users for compiling the complete data to grow the business.
Dasheroo offers a free trial version of 30 days for customer satisfaction, but it has limited features. It offers four dashboards and twelve insights grande features by spending a significant amount of 19 US dollars per month with vibrant customer support to solve any issue.
Features
- Ad Hoc Reporting
- Performance Indicators
- Integration Widgets
- Navigateable Dashboard
- Data Monitoring
Pros
- Straightforward Integration
- Reasonable Pricing Plans
- Structured Interface
- Simple Templates
- Friendly Customer Support
Cons
- Low-Quality Resolution
- Little Truly Software
- Limited Integration
- Over Simplified
5. Tableau
Tableau is the software used for transforming the data in visual analytics for easy understanding and solving the data problems. It is not limited to the size of businesses as it works with the same perfection even with small, medium, or global enterprises for data précising.

It is trusted by the organizations as it is the data-driven trusted leader. The software is mostly loved by users because of its powerful and intuitive features. It is compatible with almost all databases, including Salesforce Cloud, SurveyMonkey, Google Analytics 360, Asana, and many more.
Tableau is not entirely free to use but offers a free trial version for customers to evaluate. After using, the free trial version, users have to spend a significant amount of 70 US dollars per month with single-user access. It offers strong customer support regarding any technical problem.
Features
- A/B Testing
- ROI Tracking
- Association Discovery
- Bayesian Analysis
- Campaign Tracking
Pros
- Easy to Use
- Straightforward Integration
- Includes Charts and Maps
- Data Visualization
- Straightforward Platform
Cons
- Lack of Code Familiarity
- Difficult to Learn
- Expensive Subscription Plans
- Not Clean Data Source
6. Cooladata
Cooladata software provides an end-to-end solution to problems relating to marketing trends and visualizes the behavior of the customer and their entire journey. It allows users to streamline, combine, analyze, and visualize the shared data to empower the marketing team.
The software is used for the development of the applications. It is compatible with almost all databases, including Gmail, Mailchimp, Salesforce Cloud, Stripe, and many more. The onboarding of this software is straightforward and quick and provides live customer support.
Features
- Channel Attribution
- Cohort Analysis
- Collaboration Tools
- Configuration Management
- Data Cleansing
Pros
- Simple Onboarding
- Fast Integration
- Simple User Interface
- Valuable Outputs
Cons
- Limited to IPs Info
- CQL Understanding Required
- Bit Sparse Documentation
- High Pricing Services
7. Helical Insight
Helical Insight is an open-source business intelligence framework platform used to manage business trends. It is powered by NLP and ML and is integrated with the working engine. It is embedded with various features like an in-memory engine, email scheduling, and alerting notifications.
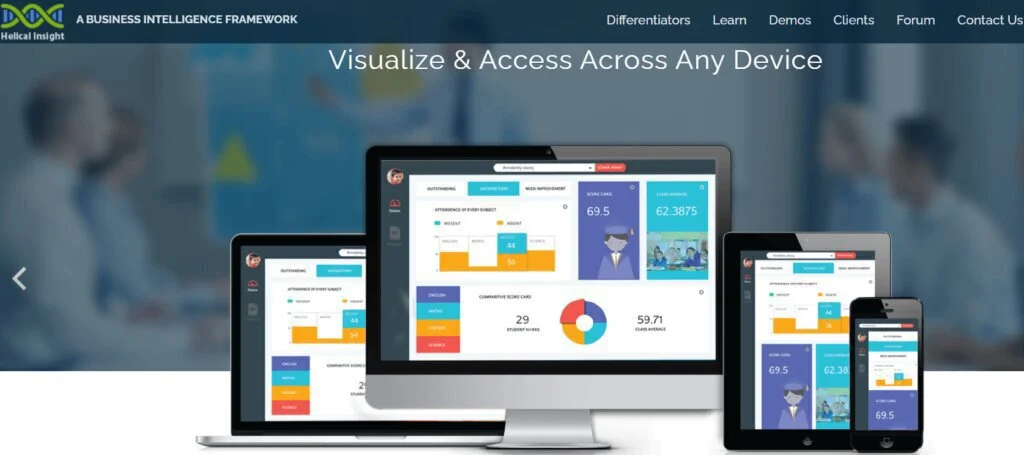
The software is compatible with both smartphones and the cloud with extensive API support. The tool is proven helpful in business decision-making via customizable dashboards, reports, statistics, and scientific charts. It is not entirely free to use but offers a free trial version for customer satisfaction.
Features
- Customizable Dashboard
- Visual Analytics
- Instant BI
- Exporting Platform
- Data Analysis
Pros
- Multi-Device Compatibility
- Scheduling Plans
- White Labelling
- Ease to Use
- Incredible Format
Cons
- Comparatively Expensive Plans
- Not Clean Data Source
- Limited Platfrom Integration
8. RJMetrics
RJMetrics is the software that is embedded with the business intelligence tools for making decisions. It provides the performance charts with the alerting notification system for showing the progress of the sales force. It is integrated with various databases and automates data replication.
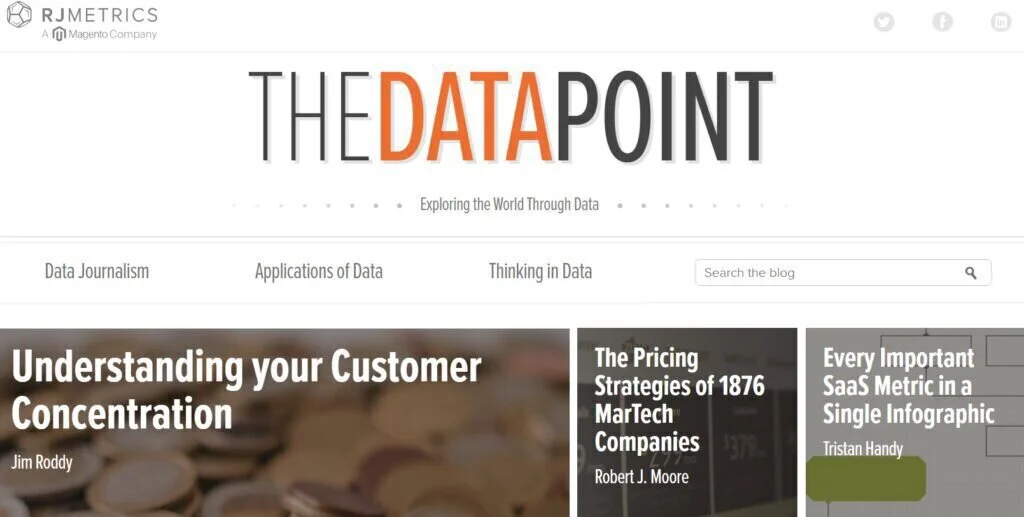
The software provides the dedicated space for analyzing the data, calculates the column figures, adds data into tables for précising the complex format of data, and builds a report of data with the advanced searching capabilities for sorting the specific data according to the requirement.
Features
- Creating Metrics
- Connecting Data Source
- Data Warehouse Manager
- Visual Report Builder
- Sharing Dashboard
Pros
- Makes Smart Decisions
- Helps eCommerce Businesses
- Drag and Drop Metrics
- One-Click Filtering
- Chart Customization
Cons
- Limited with Graphic Features
- High Pricing Plans
- Lack of Learning Skills
9. Domo
Domo is a cloud-based business intelligence platform with integrated data. It is integrated with various database platforms, including spreadsheets, social media, databases, and many other cloud platforms. It provides an advanced level of micro and macro-level for visualization of data.
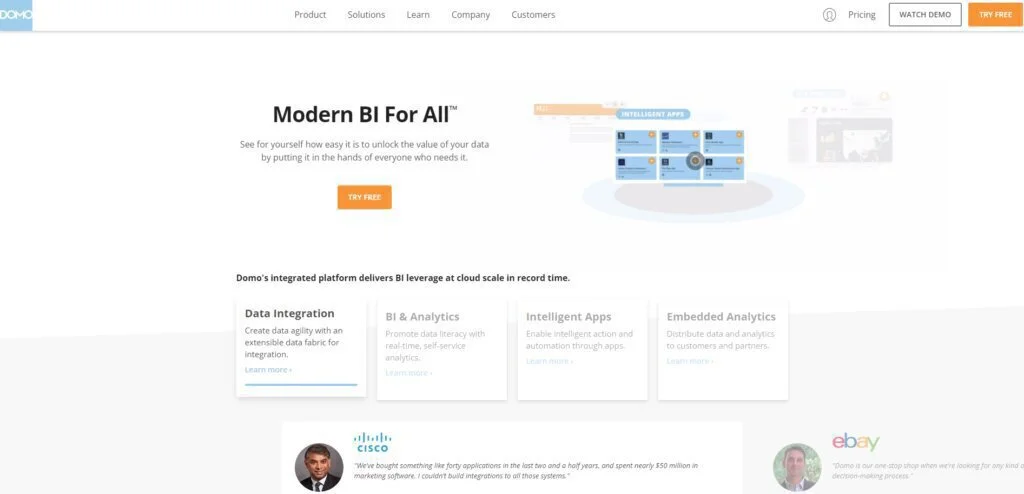
The software is compatible with Android, iOS, Windows, and Mac. The software is not limited to the size of businesses as it works with the same perfection even with small, medium, or global enterprises for data précising in tables, charts, and marketing.
Domo offers data visualization while using interactive data visualization tools. It provides the complete details of total capital investment, sale of the year, and reaming balance in the vault by using the ROI tool. The software allows the users to filter the data for perfect visualization.
Features
- Application Management
- Application Development
- Audit Trail
- Collaboration Tools
- Compliance Tracking
Pros
- Easy to Use
- Insight Customer Behavior
- Making Bar graphs
- Free Trial Version
- Live Customer Support
Cons
- Limited Free Version
- No Premium Consulting
- Expensive Packages
- Outdated Platform
10. Grow.com
Grow.com is the software that is embedded with the business intelligence tools for making decisions. The open-based software is integrated with QuickBooks, Salesforce, and Zendesk and shows the graphical representation of important data for easy understanding.
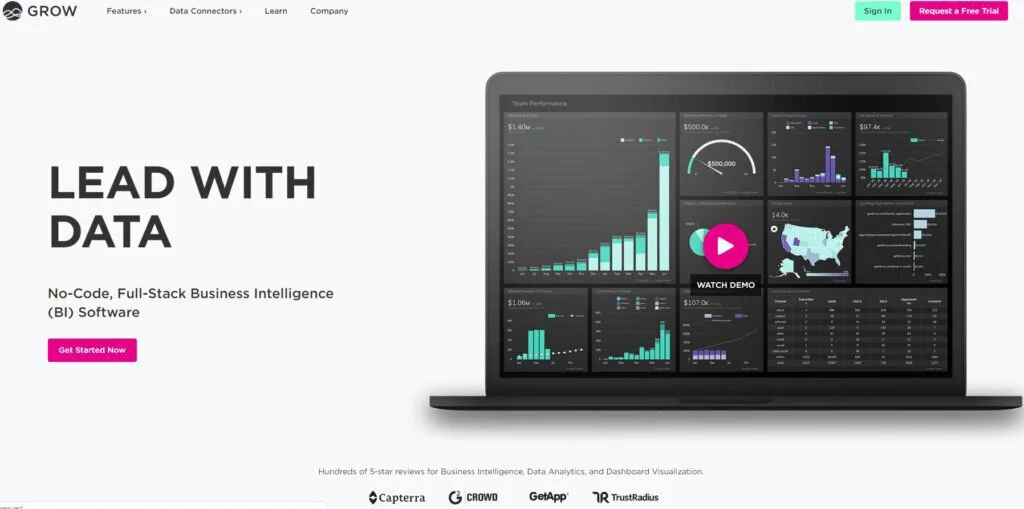
The software is not limited to the size of businesses as it works with the same perfection even with small, medium, or global environment enterprises. It is embedded with various helpful tools, including access to unlimited users, SSL encryption, a customizable dashboard, and more than 300 built-in reports.
Features
- Calculated Fields
- Data Column Filtering
- Shareable Reports
- Collaboration Tools
- Data Visualization
Pros
- Simpler User Interface
- Saves Time of Reporting
- Unlimited Integrations
- Customizable Dashboard
- Easy to Access Data
Cons
- Complex Multiple Reporting
- Low-Level Security
- Missive Customer Support
- No Empathy for Small Unit
11. ThoughtSpot
ThoughtSpot is the live analytical platform for modern data that are proven helpful for organizations in finance, communication, healthcare, and many other important fringes are managed by this artificial intelligence tool. It includes various features, including data sharing and replication of data.
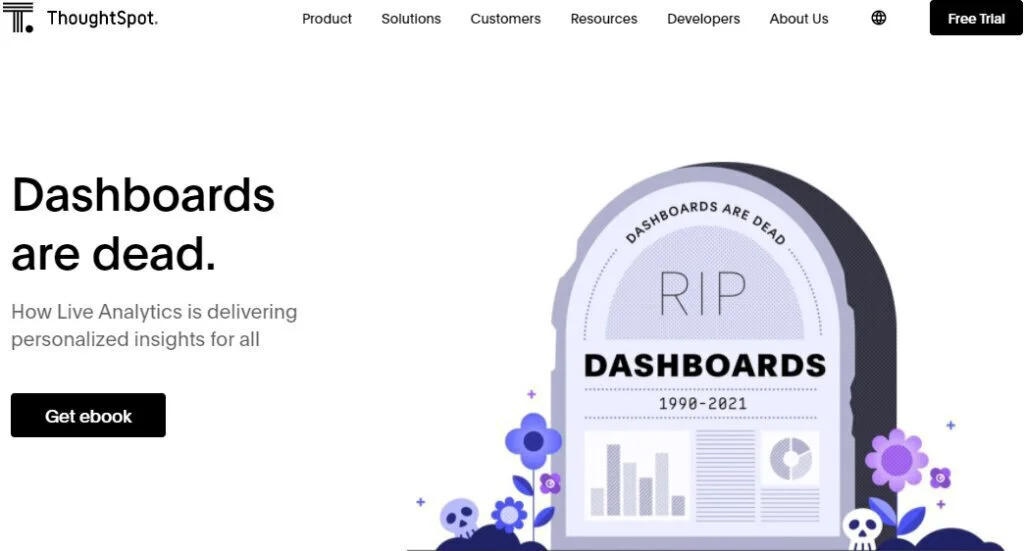
It offers the performance charts with the alerting notification system, single sign-on authentication, data drilling massively parallel processing tool MPP, and more. The software allows the users to streamline, combine, analyze, and visualize the shared data to empower marketing.
Features
- Data Capture and Transfer
- Data Migration
- Data Synchronization
- Integrated with Third-party
- Performance Metrics
Pros
- Offers NLP
- Simple User Interface
- No Licensing Fee
- Business Friendly Interface
- Smart Tools
Cons
- Glitch Saving Worksheets
- No Live Databases
- Outdated Platform
- Limited with Graphs
12. SuiteAnalytics
SuiteAnalytics is the real-time business intelligence platfrom for ERP, CRM, and e-commerce. It offers users to track the progress of Salesforce in real-time by providing detailed information on finance, sales, marketing, services, and basic fulfillments of the valuable customers at the time of need.
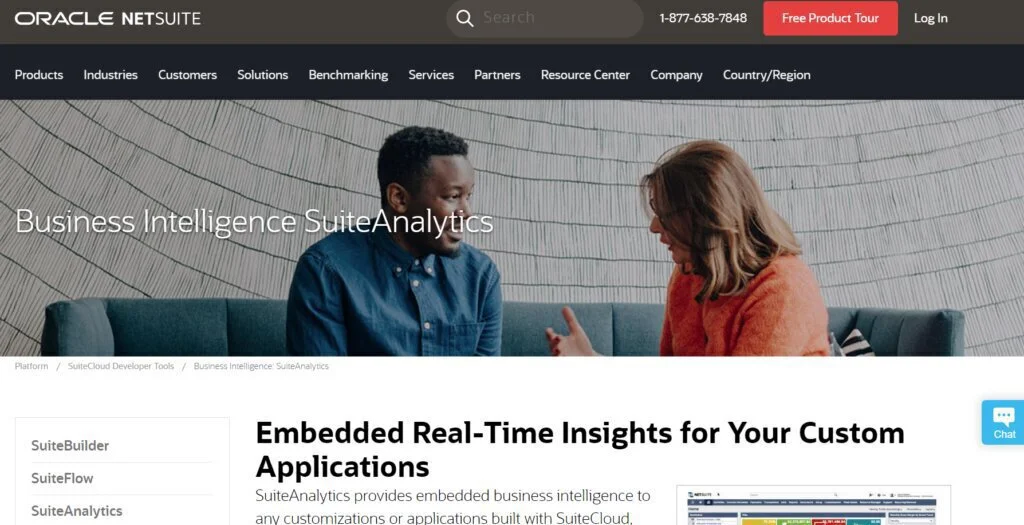
The platform offers the users to customize the dashboard features by adding a calendar for important scheduling tasks in real-time and even adding real-time RSS feeds to a customized dashboard. It allows the users to create a self-testing report before adding an important project.
Features
- Real-Time Dashboard
- Self-Service Reporting
- Analytics on the Go
- Collaboration Tools
- Integrated with Third-party
Pros
- Easily Build KPIs
- Increase Customer Value
- Reviews Analytics
- Deliver Personalized Insights
- Eliminate Multiple Version
Cons
- Expensive Subscription Packages
- Outdated Platform
- Unstructured Interface
13. Megalytic
Megalytic is the cloud-based reporting platform that is proven helpful in managing the business’s trends and for making new decisions regarding the business. It offers the users unlimited templates for even common reporting. Reports are created from scratch by using the library.
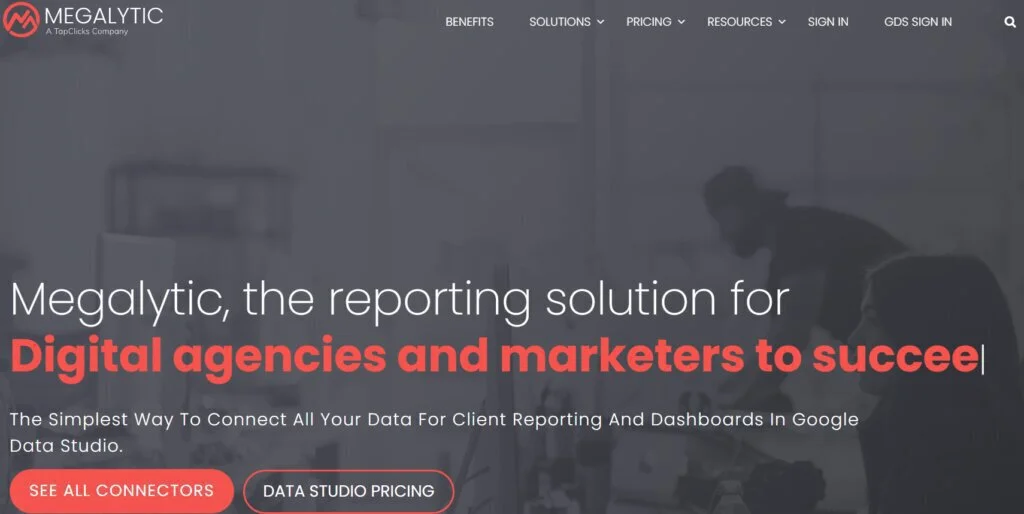
The software is based on artificial intelligence. It allows the users to set the time and date of report sending and automatically sends the reports to the clients via email. It also tracks the email delivery services. The reports sent by the users are viewed only on webpages, desktops, tablets, or as PDFs.
Megalytic offers a simple user interface for setting complex data into simpler metrics with the dashboard tools. It is not entirely free to use but offers a free trial version for customer satisfaction. After the free version, users have to pay a significant amount of 9.99 US dollars per month.
Features
- Customizable Branding
- Customizable Reports
- Goal Tracking
- Real-Time Updates
Pros
- Value For Money
- Simpler Interface
- Live Customer Support
- Customizable Dashboard
- Creates Templates Report
Cons
- High Pricing Plans
- Rigid Reporting Widgets
- Limited Advanced Features
14. DashThis
DashThis is a cloud-based marketing platform that allows the users to be precise the complex data. The software is mostly used for customizing the dashboard features of SEO, SEM, social media, analytics, and display advertising reports, and it can easily be integrated with multiple databases.
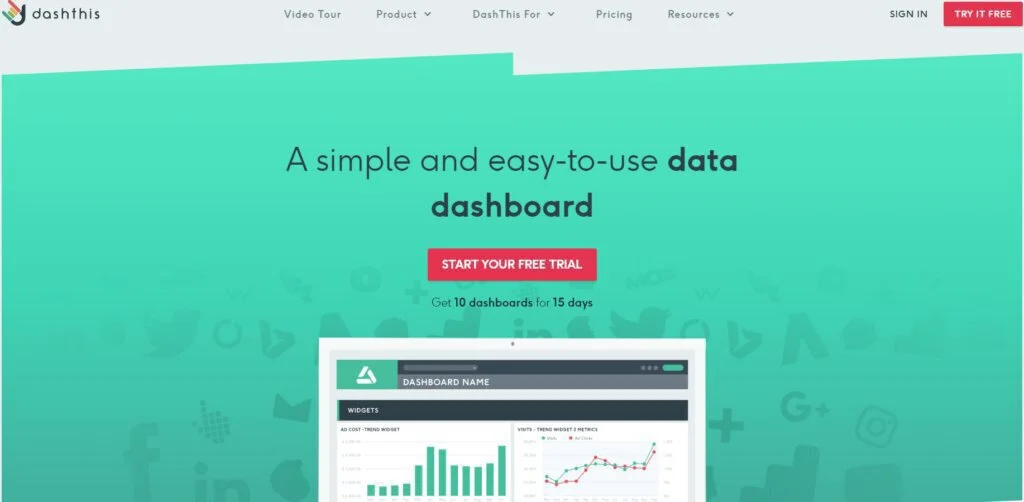
The platform offers the users to customize the dashboard features by adding a calendar for important scheduling tasks in real-time, adding logos, adding headers, adding notes, adding notification alerts for assignments, and showing the KPIs in real-time. The PDF format is shared with clients via email and fax.
Features
- Ad-Hoc Reporting
- Customizable Branding
- Dashboard Creation
- Data Synchronization
- Engagement Tracking
Pros
- Ease to Use
- Live Customer Support
- Simple Integration
- Flexible and Functionality
- Draw Analytics Forms
Cons
- Complex Interface
- Bugs Issue
- Obsolete Manual Reports
- Limited with Widgets
15. Screenful
Screenful is an analytical platfrom that is used to computerize manual reports, save time, and increase work efficiency. It offers visual projects dashboard for managing the manual reports. It includes various status reports like JIRA, Trello, GitHub, GitLab, and Asana.
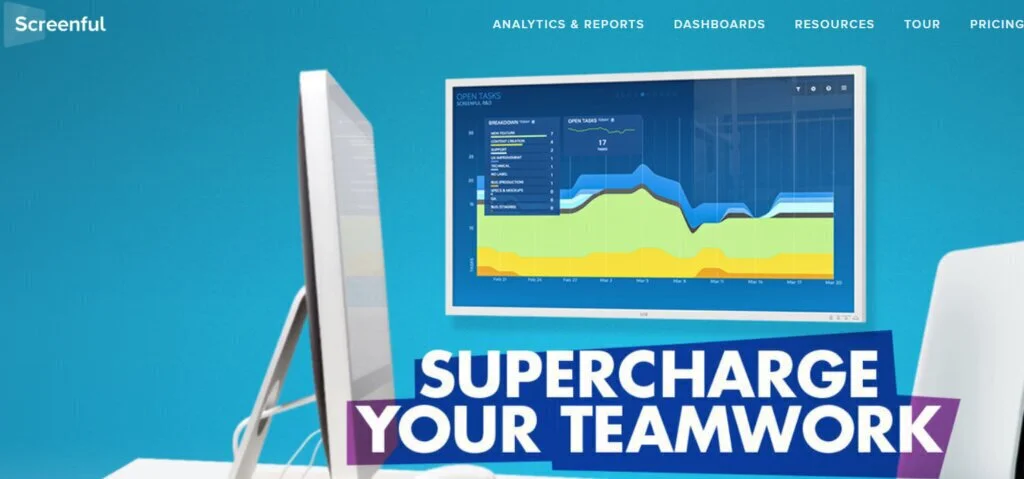
The software includes the CTOs and tech managers to track the performance of the KPIs and also allows the users to communicate the important information with others via the collaboration tool. It allows users to express their performance by switching on to the bigger screen for a clear view.
Screenful allows users to prevent the low-value weekly updates regarding the project. But it offers users to share the updates with all stakeholders and can also share any problems regarding the project. The software is compatible with smartphones and also reviews the performance of smartphones.
Features
- Collaboration Tools
- Customizable Templates
- Dashboard Creation
- Drag and Drop Functionality
- Multiple Data Source
Pros
- Tracks the Progress
- Configure Agile Environment
- Quick Performance Snapshots
- Customizable Dashboard
- Elegant in Delivery
Cons
- Complex Terminology
- Limited Customization Options
- Lacks Basic Data
- High Pricing Plans
Final Words
In this article, the Datawrapper software is discussed thoroughly. It has become handy as it is used to compress complex data in precise and easy form so that the viewer can easily understand it. The software is mainly used by journalists, software developers, and other design professionals.
The software collects the data from a platform for précising the data into charts like Excel, Google Sheets, or web URL links. Users can do live updating through the CSV/XLS as it allows the users to use customizable charts with attractive colors for effective presentation.
Many alternatives of Datawrapper are available in the market. After discussing all the aforementioned alternatives, the best two among the 15 alternatives are Domo and Tableau. They offer affordable pricing plans with a free trial and contain advanced built-in features and professional tools for managing the data.
